Dashboard
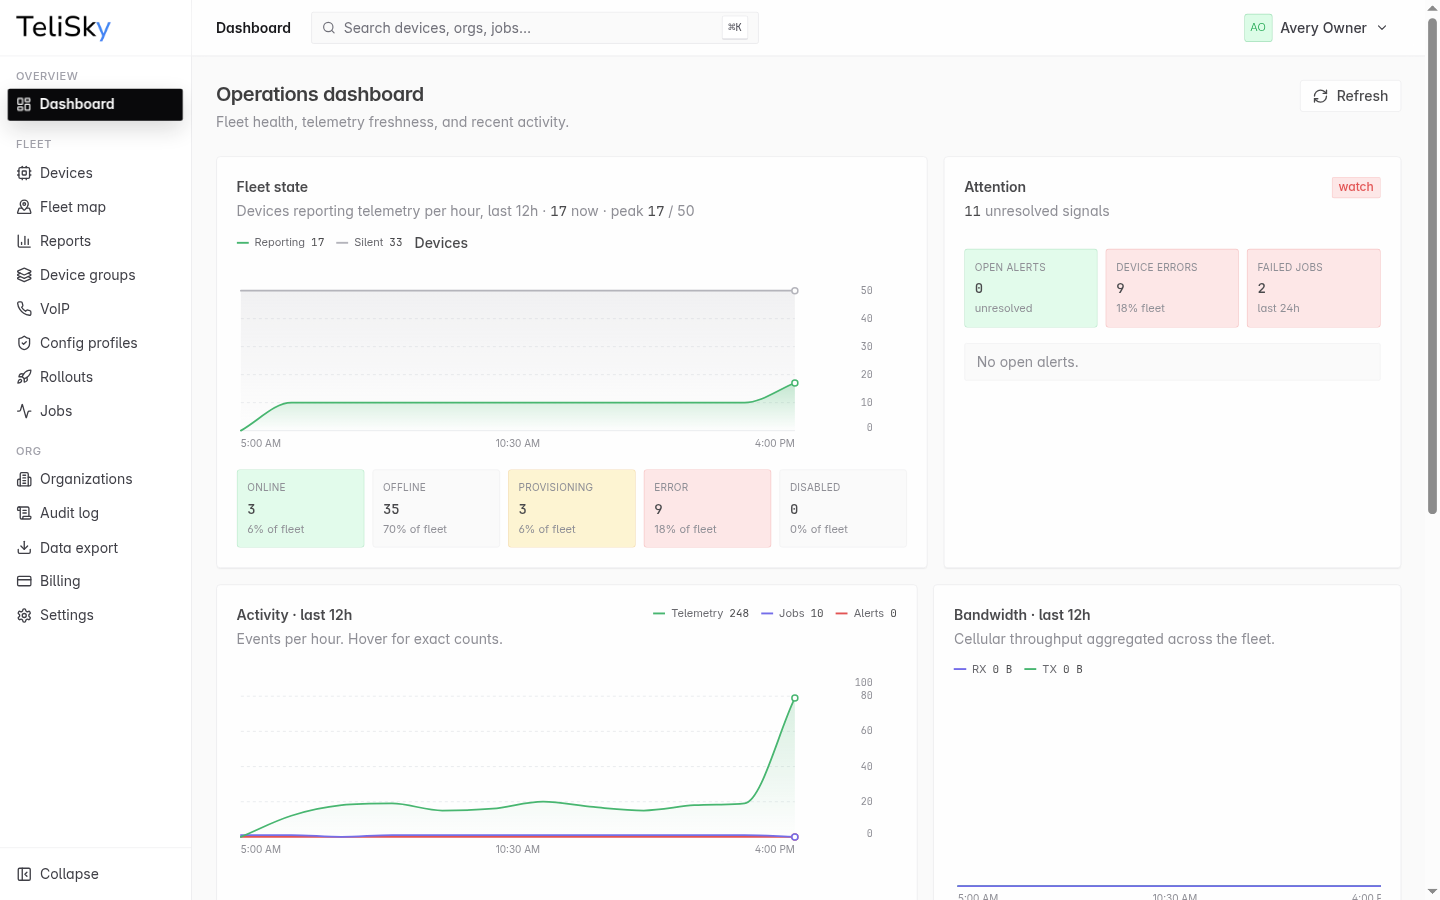
The MDM dashboard provides an at-a-glance overview of your entire device fleet.
Main Dashboard
Section titled “Main Dashboard”After logging in at cloud.telisky.com, the main dashboard displays:
Quick Stats
Section titled “Quick Stats”- Total Devices — Number of registered devices in your organization
- Online — Devices currently connected and reporting
- Offline — Devices that haven’t reported within the expected interval
- Alerts — Active unacknowledged alerts
Recent Activity
Section titled “Recent Activity”A timeline of recent events:
- Device online/offline transitions
- Firmware update completions
- Configuration changes applied
- Alert triggers and resolutions
Fleet Health
Section titled “Fleet Health”Summary metrics across your fleet:
- Average signal strength
- Connection uptime percentage
- Firmware version distribution
- Devices requiring attention
GPS Fleet Map
Section titled “GPS Fleet Map”For devices with GPS capability, the fleet map shows:
- Real-time device positions on an interactive map
- Color-coded markers by status (green=online, red=offline, yellow=warning)
- Click any device for a popup with location details, speed, and heading
- Cluster view for high-density deployments
- Filter by device group, status, or tag
Map Controls
Section titled “Map Controls”| Control | Function |
|---|---|
| Zoom +/- | Map zoom level |
| Layers | Switch between map/satellite view |
| Filter | Filter visible devices |
| Fullscreen | Expand map to full screen |
| Auto-refresh | Live position updates (30s interval) |
Device Status Colors
Section titled “Device Status Colors”| Color | Meaning |
|---|---|
| Green | Online, operating normally |
| Yellow | Online with warnings (weak signal, etc.) |
| Red | Offline or error state |
| Gray | Never connected / inactive |
Navigation
Section titled “Navigation”The portal sidebar provides access to all sections:
| Section | Purpose |
|---|---|
| Dashboard | Fleet overview (this page) |
| Devices | Device list and management |
| GPS Map | Fleet map view |
| Alerts | Alert rules and history |
| Firmware | Firmware versions and deployments |
| Users | User management (admin) |
| Settings | Organization settings |
Customization
Section titled “Customization”Dashboard behavior can be configured per-user:
- Auto-refresh interval — How often data refreshes (default: 30s)
- Default view — Which page loads after login
- Timezone — Display timestamps in local time
Mobile Access
Section titled “Mobile Access”The portal is responsive and works on tablets and phones. For field technicians, key actions are accessible on mobile:
- Check device status
- View device location
- Trigger remote commands (reboot, sync)
- View recent alerts